
These days, security teams need information and context about data to keep it safe from red teamers (who can uncover attack paths). The data can be protected if we have visibility over it. As the number of services and applications in today’s IT environments keeps increasing, it has become harder for resource providers to manage and find them all. That’s where service discovery comes in.
Service discovery is used to identify, explore, and analyze services of resource providers. In recent years, there has been a rising demand for tools that can help people and organizations discover and visualize services and resources in a graphical context. One tool that can be especially useful for this purpose is cartography, an open-source Python tool that helps enable a broad set of visual exploration of the services.
This blog explains how to use the Cartography tool for service discovery, its data security benefits, and its reliance on the Neo4j database. Cartography is strong at revealing the hidden dependencies between the service’s assets that helps validate assumptions about security risks by understanding those dependencies.
The tool is designed to help enterprises understand, explore, and track the relationships between entities in their environment. Compared to other security tools, cartography is general and expandable enough to help anyone and can offer better understanding of their risk exposure, no matter what platforms they use.
What is Cartography?
Cartography brings together infrastructure assets and their relationships in an intuitive graph view powered by a Neo4j database. It works on both Linux and Windows servers, but it has only been tested on Linux servers so far.
What is Neo4j?
Neo4j is a popular graph database, and it’s written in Java. It provides Cypher Query Language (CQL), which is used to represent graphs visually. It stores data and displays it as a graph, and it doesn’t use tables, columns, and rows to store data or present data in a tabular way.
Why Graph Database?
Standard databases focus only on capturing individual data points, while a graph database consists of two items: nodes and relationships. The nodes are the individual data points, and the relationships describe how those data points are connected to one another.
Cartography Setup
- Install the Neo4j graph database on your server by downloading Neo4j Community Edition
- Configure the data sources for resource providers like AWS, Azure, or GCP services
- Run Cartography using ‘pip install cartography’ to install the code
- Sync your data by running the command below
cartography --neo4j-uri bolt://localhost:7687>
Once Cartography and Neo4j are installed and synced with the data, you can view the Neo4j web interface at http://localhost:7474.

These days, Security teams need information and context about data in order to keep it safe from Red Teamers (who can uncover attack paths). We can protect the data if we have visibility over it. This can be done using Cartography.
Cartography Workflow
Cartography syncs the infrastructure assets of the resource provider and pushes the data to the Neo4j Database.
Here are the steps for Cartography Sync – Get, Transform, Load, Cleanup
- The GET function pulls the necessary data from a resource provider API.
- The TRANSFORM function helps convert the data to make it easier to add into the graph.
- The LOAD function pushes the processed data to Neo4j.
- After adding the nodes and relationships to the graph, if the most recent data needs to be resent to the database, then old nodes and relationships that no longer exist will be deleted as part of the CLEANUP function.
Sample Neo4j graph database
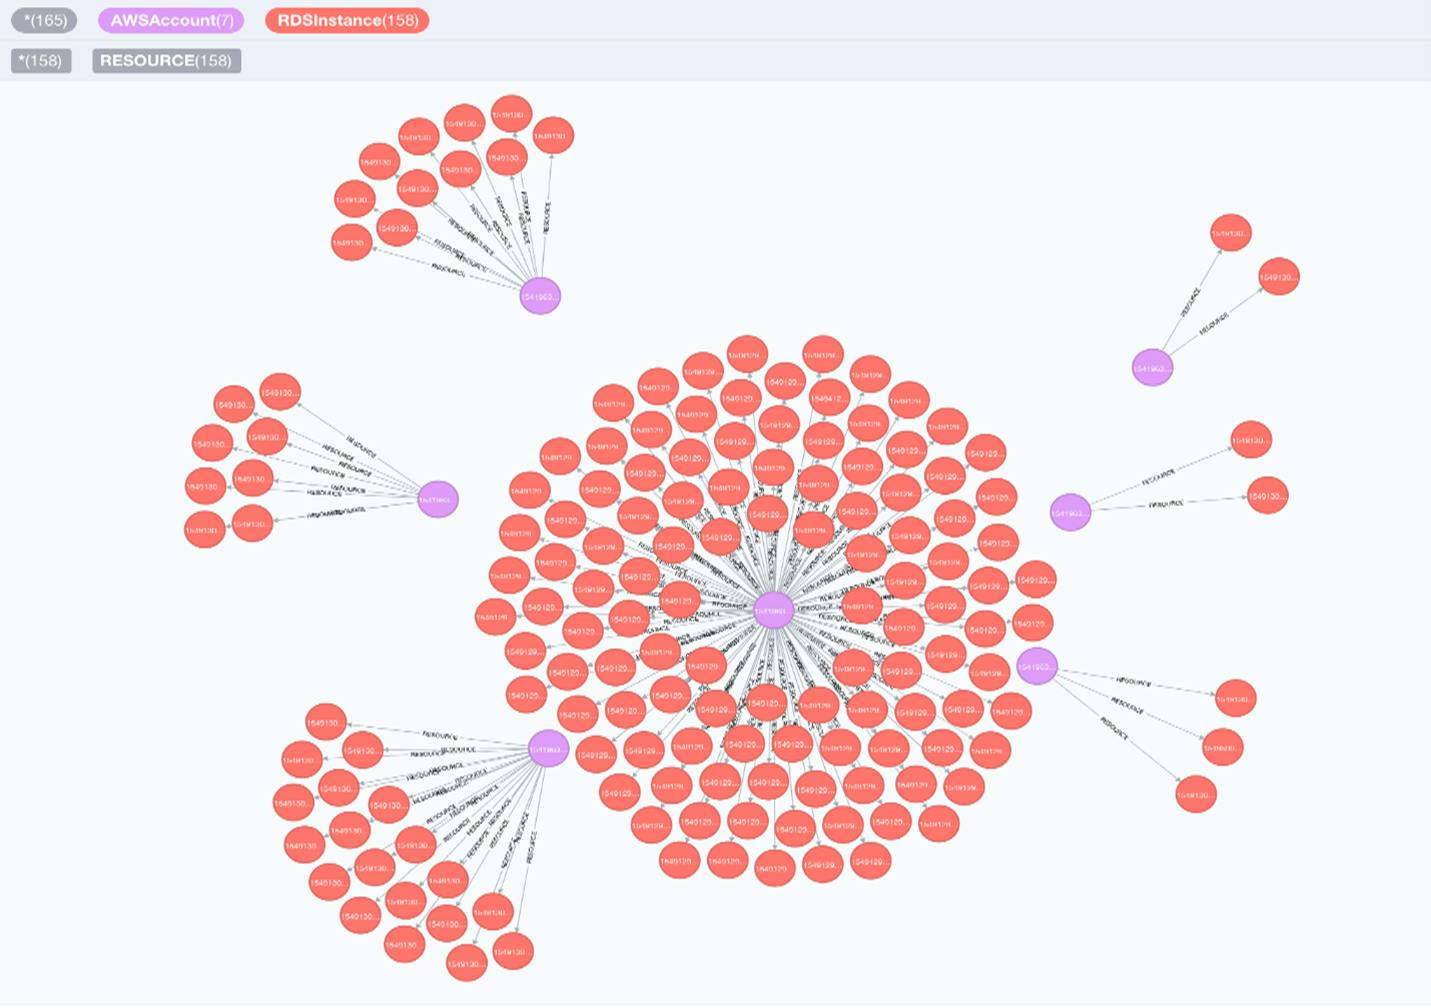
Source: https://github.com/lyft/cartography/blob/master/docs/root/images/accountsandrds.png
Supported platforms and Services
- Amazon Web Services – API Gateway, EC2, Config, Elasticsearch, Elastic Kubernetes Service (EKS), IAM, Inspector, Lambda, KMS, RDS, Route53, Redshift, DynamoDB, and S3
- Microsoft Azure – CosmosDB, Virtual Machine, Storage, SQL
- Google Cloud Platform – Cloud Resource Manager, Compute, Google Kubernetes Engine, Storage, and DNS
- Google Workspace – Groups, users
- Oracle Cloud Infrastructure – IAM
- Okta – users, groups, roles, applications, and organizations
- Kubernetes – Service, Pod, Cluster, Namespace, Container
Benefits of Cartography
- Cost optimization of the services – After the Cartography sync, you can review the Neo4j services and address unused services by deleting those that are no longer needed, which helps save money on those services' costs.
- Improved security – Data transparency reveals vulnerabilities, allowing for regaining control.
- Dependency identification – Provides information about the dependencies among the services and their properties that can be seen in the database, so cloud providers can better understand how service disruptions could impact other services
- Consolidation of all services – All the services from cloud providers can be viewed in a single place, so cloud users can more easily monitor their resources. This saves time and effort compared to managing multiple services in different places.
- Visualization of data in multiple forms – Node data can be seen not only through graphs but also in different forms like tables, text, and code. Tables help provide a structured overview of data, while text offers context and explanations. Code can make data analysis more transparent and reproducible. Using data in multiple forms makes it possible to provide a more complete and thorough understanding of data insights.
- Export the data – The node data and its relationships can be downloaded in different forms like JSON (JavaScript Object Notation), CSV (Comma Separated Values), PNG (Portable Network Graphics), and SVG (Scalable Vector Graphics). With data in different formats, users can pick the format that best suits their needs and work with data in a way that is most effective for them. JSON and CSV are great for developers and data analysts, while PNG and SVG are better for sharing the data with others and visualizing it.

